A Minimalist Approach to Monitoring Servers
Written by Rickard Lindberg  in #linux
Previously, I wrote about a minimalist approach to managing servers. In it, I concluded that the next step is to come up with a minimalist approach to monitoring servers. I now have a solution for that that I will explain in this post.
It works by running a "monitoring report" script periodically on the server. It collects information and sends an email report to me. Right now it sends me an email daily that contains, among other things, a list of packages that can be upgraded. It looks something like this:
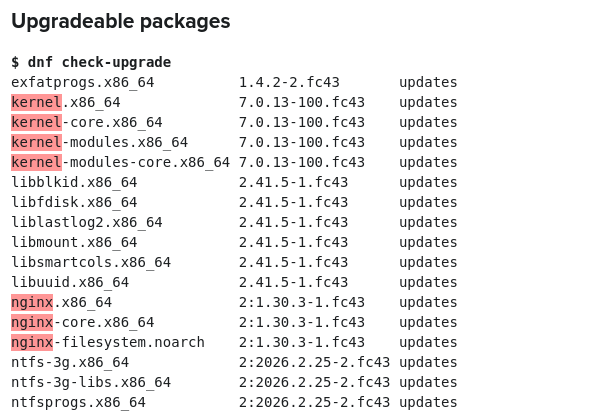
It also highlights packages that I find especially important to upgrade. When I have time, I can perform an "ospatch" to upgrade the packages.
This workflow is good because it has the feedback loop set up. Every day (which I might change to every week), I get a monitoring report that I can look at and determine if I need to take any actions. Furthermore, I can tweak the contents of the report to become more and more useful over time. This solution gives a lot of "bang for the buck" and fits nicely with the minimalist approach.
I use this monitoring setup on a server that hosts custom wiki software. I take backups of the wiki manually. But one problem I had was that I didn't know when to take backups. So I modified the wiki to log whenever someone made a change. Then I included that log in the monitoring report. So every day, I can see if someone made a change to the wiki and if they did, I can take a backup.
Another thing that I include in the monitoring report is error logs. At one point I saw lots of errors from nginx trying to access files that did not exist. Turns out that random bots tried to access files via HTTP. I don't serve any content over HTTP. So after doing some research, I found I could configure nginx to return 444 which drops the request without processing it further.
This monitoring setup is configured using the minimalist approach to managing servers. It consists of a systemd timer and a custom Python script that constructs the report email and sends it using the local sendmail server.
The systemd timer is configured in /etc/systemd/system/monitoringreport.timer and looks like this:
[Unit]
Description=Run monitoring report daily

[Timer]
OnCalendar=daily
Persistent=true

[Install]
WantedBy=timers.target
The timer triggers a oneshot job configured in /etc/systemd/system/monitoringreport.service which looks like this:
[Unit]
Description=Monitoring report job

[Service]
Type=oneshot
ExecStart=/opt/monitoringreport.py
Finally, the monitoring report script is at /opt/monitoringreport.py and looks something like this:
#!/usr/bin/env python

from email.message import EmailMessage
import datetime
import html
import shlex
import smtplib
import subprocess

ERROR = "background: rgb(255, 150, 150);"
HIGHLIGHT = "background: rgb(255, 198, 89);"

def capture_stdout(command):
    return subprocess.run(
        command,
        stdout=subprocess.PIPE,
        text=True
    ).stdout.strip()

def command(command, title, body, highlight={}):
    body.append(f"<h2>{html.escape(title)}</h2>")
    body.append("<pre>")
    body.append(f"<strong>$ {html.escape(shlex.join(command))}</strong>\n")
    output = html.escape(capture_stdout(command))
    for text, style in highlight.items():
        output = output.replace(text, f"<span style=\"{style}\">{text}</span>")
    body.append(output)
    body.append("</pre>")

print("Preparing email")
host = capture_stdout(["hostname"])
date = datetime.datetime.now().isoformat()[:10]
body = []
command(
    ["dnf", "check-upgrade"],
    "Upgradeable packages",
    body,
    highlight={
        "kernel": ERROR,
        "nginx": ERROR,
        "ssh": ERROR,
        "flask": ERROR,
    }
)
command(
    ["journalctl", "--since", "24 hours ago", "-o", "short", "--no-hostname", "-p", "err"],
    "Error logs",
    body,
    highlight={
        "nginx": HIGHLIGHT,
        "wiki": HIGHLIGHT,
    }
)
msg = EmailMessage()
msg.add_alternative("".join(body), subtype="html")
msg["Subject"] = f"{host} {date} Monitoring Report"
msg["From"] = "noreply@<your domain>"
msg["To"] = "<your email>"

print("Sending email")
s = smtplib.SMTP("localhost")
s.send_message(msg)
s.quit()

print("Done")
To try the job, I can run the following command:
./make.py shell systemctl start monitoringreport
I can easily add new commands whose output show up in the monitoring report email. That way I can improve the report over time.
What links here?
- Newsletter August 2026: Interface Design (again) This month started off with some more C programming in rlworkbench. I started implementing a piece tree and made some internal changes to try out...
Mentions:
- 2026-08-06 ♥ https://crowdersoup.com/blog/post/like-1786043083/
What is Rickard working on and thinking about right now?
Every month I write a newsletter about just that. You will get updates about my current projects and thoughts about programming, and also get a chance to hit reply and interact with me. Subscribe to it below.